Title: White Collar Crime Risk Zones
Author(s): Brian Clifton, Sam Lavigne, and Francis Tseng
Publication: The New Inquiry
Publication date: March 2017
Experience here: https://whitecollar.thenewinquiry.com/

It’s moving day here in Madison, Wisconsin. Students are returning for fall semester, and residents across the city are packing up for a new start. After unloading the U-Haul and unpacking the dishes, new residents will begin to get familiar with their neighborhoods, and online searches are an obvious and easy way to find not only nearby coffee shops and laundromats but a variety of location-specific data.
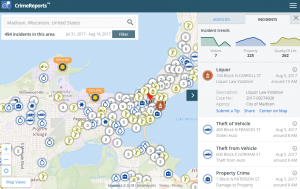
In particular, a quick Google search for “how much crime is in my neighborhood” reveals an interest in tracking crime through interactive maps. One such site, CrimeReports.com, uses local police reports to track incidents and display this information to users through a Google map of the city. When the Madison Police Department partnered with CrimeReports.com in 2009, they cited citizen demand to “see basic patterns relating to crime issues in the city” and further hoped that analysis of this data would help them try predictive policing tactics.
This use of big data, algorithms, and machine learning for predictive policing has been called into question since being named one of the best 50 inventions of 2011 by TIME Magazine, especially as part of conversations about race and policing. Although promising to revolutionize policing, prevent crime, and educate residents about the relative “safety” of certain places, others have critiqued it for relying on historical data, focusing on street crime, and perpetuating bias.
“White Collar Crime Risk Zones” (referred to as WCCRZ) is our Webtext of the Month because it uses algorithms, machine learning, and interactive media to expose the potential biases of these technologies. In an interactive map, white paper, and iPhone app, this project satirizes sites like CrimeReports.com to critique both place-based and person-based predictive policing. In doing so, it raises important questions about how we approach big data and its representations in interactive media, as well as challenging us to think about the ways we understand and prosecute “street” crime.
THE MAP
If you’ve just moved to Madison, you can use CrimeReports.com  to see what crime looks like in your neighborhood. Simply type in your address, and you’ll find incident reports from the past 15 days for crimes. For example, between July 31 and August 14, 494 incidents are reported to have occurred in Madison: 7 violent, 225 property, and 262 quality of life. Looking around the map, the crimes represented here include battery, assault, breaking and entering, disorder, and liquor.
Worried that citizens would feel panic or fatigue from an overwhelming number of crimes appearing on the map, the Madison Police Department chooses not to show crimes in all categories available through CrimeReports.com. And this makes sense—a map overwhelmed with information wouldn’t be useful. However, WCCRZ draws our attention to what kinds of crimes we see on maps like these and how this data is used in predictive policing.
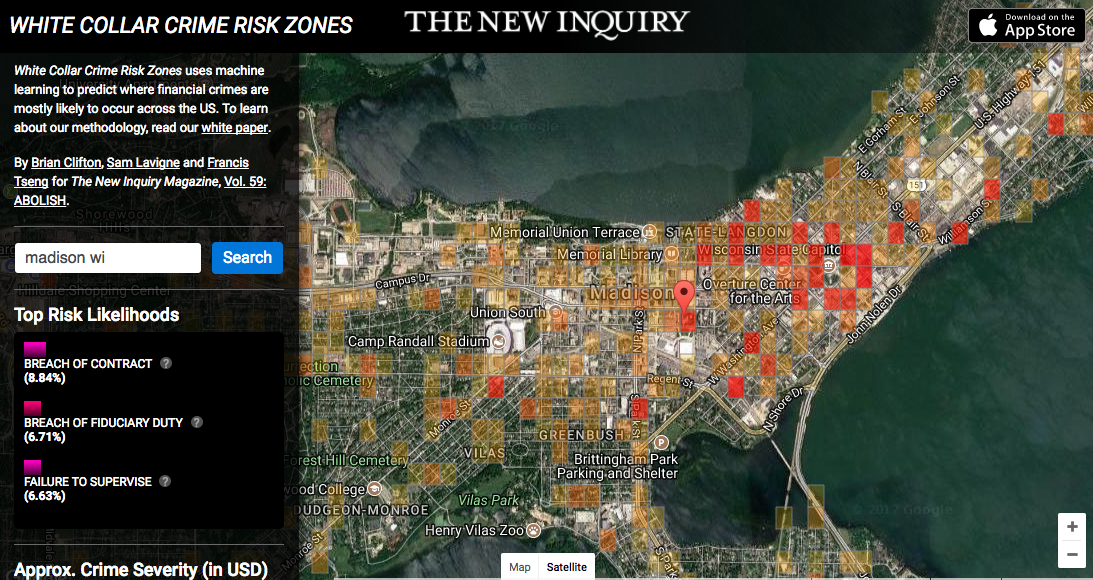
Much like CrimeReports.com, WCCRZ allows you to type in your address and look at the crime in your area. The difference, however, is that it shows white collar crime, and not “street” crime, at large in your own neighborhood. WCCRZ then identifies locations with “risk likelihood” for crimes like unauthorized trading or breach of fiduciary duty, overlaying the map with deep reds for high risk areas and yellows for more moderate risk.
In Madison, dense areas appear around downtown, with labels like, “breach of fiduciary duty,” “breach of contract,” or “failure to supervise.” It also lists nearby financial firms and an approximation of the crime severity listed in US dollars. This draws our attention to a sharp contrast between the crimes listed on other predictive sites that focus more on crimes like theft, liquor, or disorder.
THE WHITE PAPER
The project is accompanied by a white paper detailing how the map works. Using data on financial crimes from the Financial Regulatory Authority since 1964, WCCRZ uses a machine learning algorithm to predict where financial crimes are mostly likely to occur across the US.
It’s stated purpose is “to identify high risk zones for incidents of financial crime,” to predict the nature and severity of a white collar crime, and to equip citizens for policing and awareness (3). They suggest that an opportunity has been missed to target financial crimes in previous predictive policing efforts because of a dominant concern with “street” or “traditional” crimes.
Although not yet part of the map, the whitepaper ends with a discussion of how future projects might also attempt to try out person-based predictive policing through facial analysis and psychometrics. This reflects a recent concern with not only identifying and tracking regions where crimes happen, but also the bodies of criminals.
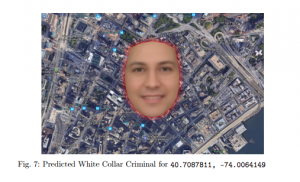
WCCRZ critiques this in a future proposed model for the project.  The authors note that the model focuses on a geospatial region, but that it doesn’t yet “identify which individuals within a particular region are likely to commit the financial crime” (8). They discuss applying this machine learning to facial analysis to identify “criminality” in individuals. Using photographs of 7000 financial executives from LinkedIn, WCCRZ produces an averaged image of the “generalized white collar criminal” (8). The image of a particular face calls into question methods that can serve as a different medium for racial profiling. By describing general characteristics, we are then enabled to read into every similar face the possibility of a threat.
THE APP
By creating an app for the WCCRZ that alerts users when they enter a “high risk zone for white collar crime,” the map becomes a way to navigate space through the use of GPS. If I were to walk into the Capitol Square, I would be alerted not of a Pokemon, but of the risk of encountering defamation or breach of fiduciary duty. These quick blasts virtually stop the user in their tracks and hail them to account for where they are, their position in that particular space, and who might be a potential offender.
The app also links to several sources, like this “Statement of Concern about Predictive Policing,” “Machine Bias,” and “What You Need to Know about Predictive Policing.” While much of the WCCRZ implicitly satirizes predictive policing, it also provides users with the means to learn more about how these algorithms work and why we should not consider them politically or rhetorically neutral.
CONCLUSION
By creating an app that uses machine learning technology mirroring that of other predictive policing, WCCRZ critiques place-based and person-based predictive analysis, drawing attention to the disparity between consequences for financial crimes and “street” crimes. Importantly, it also demonstrates that data, algorithms, and machine learning are not simply benign tools used to collect objective information. It asks us to look closer at data to identify when it is simply functioning as a feedback loop for its own programmed set of expectations. Programs can function as an argument, and often they can seem even more persuasive when they appear to rely on systems that use methods or data we often consider thorough and neutral.
