Methods of big data analysis have helped enterprises better understand their users and the market, and to make timely business decisions. Analytical systems collect, collate, and report critical business data, enabling businesses to look at users’ characteristics more closely. Google Analytics (GA) is one of the most popular data analysis tools for web platforms. According to W3Techs, GA is used by 52.9 percent of all websites on the internet. GA provides descriptive, prescriptive, and predictive approaches to analyze data (Iyamu, 2018) that technical communicators can use to measure user characteristics, engagement, and usability. However, they fall short in identifying subjectivities in data sets, especially surrounding marginalized populations. After taking a close look at powerful aggregating functions in GA, we ask how technical communicators can advocate for users farthest at the margins without requiring those users (and themselves) to participate in problematic surveillance digital systems that profit from their internet use.
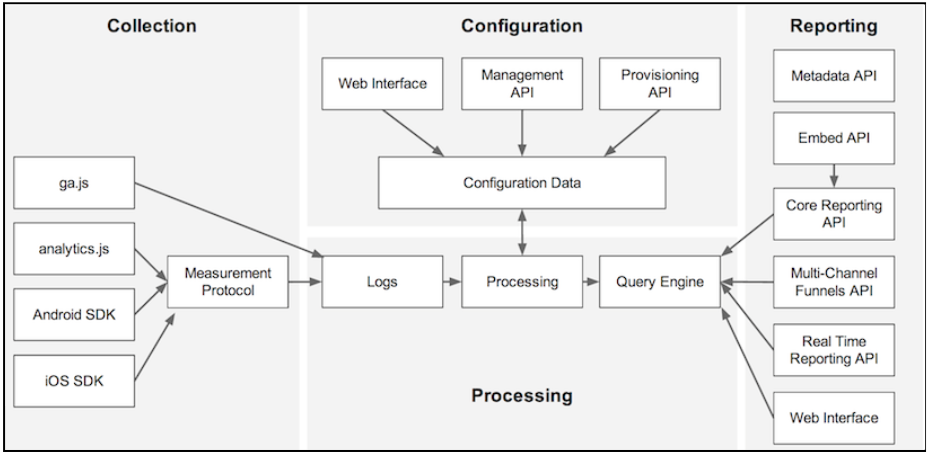
Google Analytics is a free web activity data collector, aggregator, and reporter. The tool provides data on all web traffic to a given domain, segmenting that traffic in reports that complement related products, like Google Ads and the Google Display Network. The GA platform consists of four activities based on dimensions (user characteristics) and metrics (quantitative interaction information):
- Collecting
- Configuration
- Processing
- Reporting
The Google Analytics Developers guide provides a helpful visualization to describe the platform’s activity.
Google Analytics enables technical communicators to check metrics, spot trends, and identify content audiences spend most time viewing. Since GA is supported by the most popular search engine in the world, it has access to most of the world’s web pages. Apart from such wide access, there are several benefits of using GA over other tools. The Google Analytics interface is full of useful data and valuable insights, providing multiple ways to visualize data including tabular reports (default), pie charts, pivot tables, comparison charts and performance charts. The various report types allow technical communicators to dive deeper into understanding customer behavior. For example, the All Traffic report (see Figure 2) provides an immediate picture of traffic origin while Audience reports (see Figure 3) help categorize users based on their levels of engagement. Such insights help to inform content strategy.
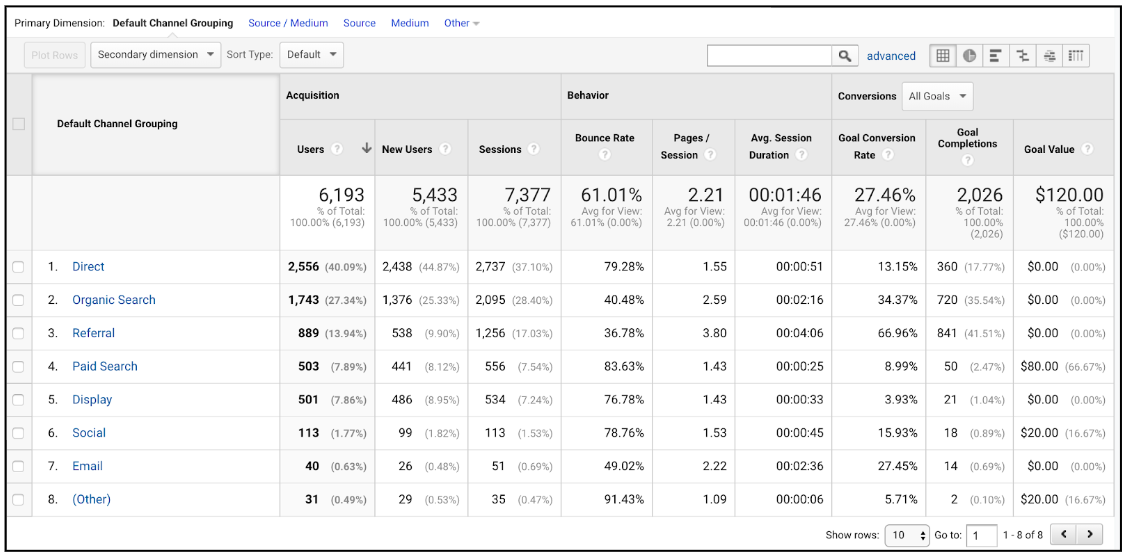 Figure 2. GA All Traffic > Channels report. Google and the Google logo are registered trademarks of Google LLC, used with permission.
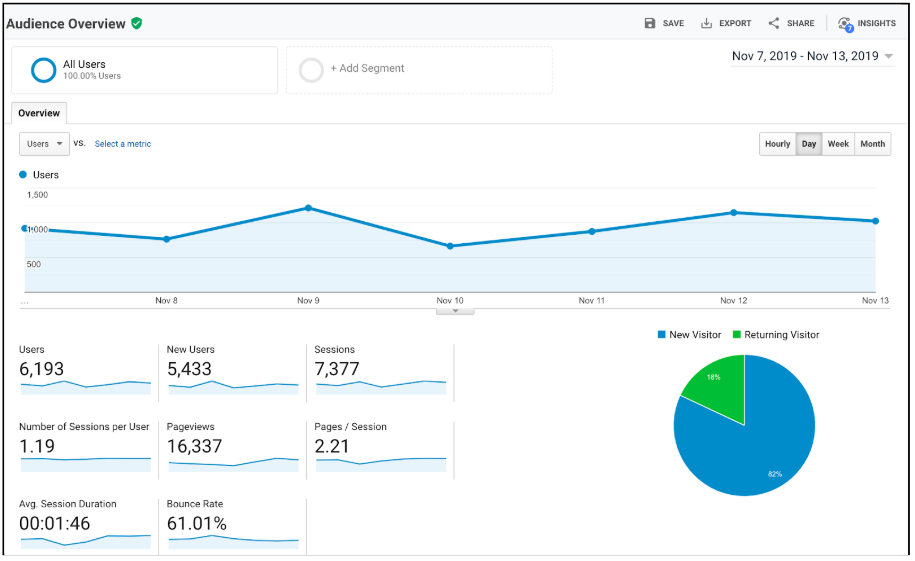
Figure 3. GA Audience > Overview report. Google and the Google logo are registered trademarks of Google LLC, used with permission.
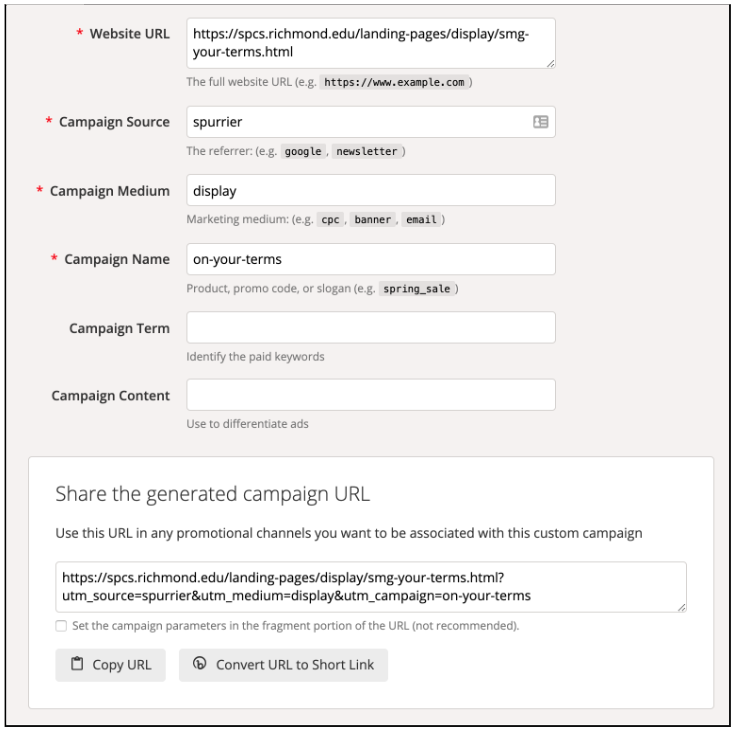 Figure 4. Google Campaign URL Builder. Google and the Google logo are registered trademarks of Google LLC, used with permission.
As Web Manager at the University of Richmond School of Professional & Continuing Studies, Daniel has access to Google Analytics reports He also places the ga.js and analytics.js code calls on the site’s pages using Google Tag Manager, enabling GA to collect data through the measurement protocol, which delimits the kind of information that GA can collect. As the school’s technical communicator, Daniel places code calls on the page as part of the collection activity and defines and views reports in the reporting activity, but he has neither access to nor authority over GA’s configuration and processing activities. To technical communicators, much of the GA platform is a black box where data is aggregated and processed, then reported without a clear sense of what happened to the data between collection and reporting.
Nupoor used Google Analytics for user behavior research at SAS, a data analytics company in Cary, North Carolina. As a technical communication research intern, she used it for reporting purposes, to track user journeys on the product documentation website. Her research revealed information about the most frequently accessed web pages on the product documentation website. She also tracked pages where users spent the most time along with the tools they used most frequently to search site content.
Google Analytics is free for web developers and technical communicators to install on their websites, and for good reason. While Google appears to be giving away its data storage and processing power freely, the GA platform is collecting data from billions of page visits daily. A technical communicator has access to data reported from a single website or set of websites, but Google has access to reports on data collected, configured, and processed from millions of web pages. Visitor habits and demographics collected from the majority of the world’s websites is valuable, enabling Google’s parent company, Alphabet, to leverage and monetize data across its many enterprises, including Google Ads, Chrome, Deepmind, YouTube, Android, and dozens more. In addition to the tool being free, Google-generated help is also free, enabling technical communicators to make the most efficient use of the tool. KoMarketing, a B2B online marketing agency, lists over 15 free Google tools as sources of training in using GA.
Google Analytics is valuable to technical communicators who measure the success of communication efforts across multiple platforms, including email, social media, web, apps, and more, by tracking the number of visitors engaging with content. In addition to built-in support for Google Ads reporting, campaign parameters can be added to URLs (see Figure 4) embedded in web-based messages and tracked through GA.
 Figure 4. Google Campaign URL Builder. Google and the Google logo are registered trademarks of Google LLC, used with permission.
Setting up Google Analytics properties and views in the administrative console is relatively straightforward for technical communicators. Data collected can be configured, processed, and reported. One of the most frequently used methods involves setting up a view that filters data into and/or out of the collection activity, which in turn affects what can and can’t be configured, processed, and reported (see Figure 5).
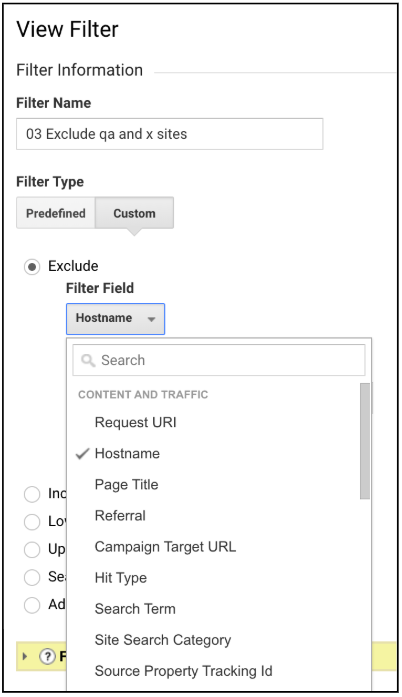 Figure 5. GA filter options in view setup. Google and the Google logo are registered trademarks of Google LLC, used with permission.
Such filters, although easy to use, cause the collection function to omit external traffic, internal (institutional) traffic, or mobile traffic. Filters might also exclude data that is unavailable for filtering. Additionally, visitors to a given website may be unaware that Google Analytics is installed and will be used to collect their activity on the site. A visit to the site’s Privacy Policy is unlikely to name Google Analytics as the web traffic analysis tool installed; instead, general language about data collected, like that on the Google Privacy Policy is used: “The information Google collects, and how that information is used, depends on how you use our services and how you manage your privacy controls.” Only browser developer tools reveal that analytics.js is installed, but most users don’t use them. Individual website privacy policies, and not GA itself, determine whether a visitor can opt out of the GA platform activity. Users can install a browser plugin to opt out of all GA collection across all sites, but this is a user-initiated activity beyond normal web browsing behavior. As a result, the responsibility of offering the opportunity to opt out of GA collection activities rests on the technical communicator of the site.
All data required for analysis is collected automatically through cookies and other similar sources. By collecting this data, Google Analytics (GA) provides access to users’ demographic data; however, this data excludes populations that do not have stable internet access. Gonzales’ (2015) research shows that, in at least one of the cities in the US, the likelihood of persons with college education to have access to computers is 23 times greater, and access to the internet seven times higher than for those without a college degree . Such populations are vulnerable, and get further marginalized due to their exclusion from critical resources. On the one hand, lack of digital literacy and/or infrastructure leads to marginalization based on access; on the other hand, mere access to technology without knowledge about data security and privacy leads to marginalization through aggregation. Therefore, the role of technical communicators becomes even more crucial.
Filters set when setting up GA properties and views may include or exclude the collection of data useful in helping a technical communicator understand the impact and reach of a given website in two ways. These filtering choices are rhetorical: they determine which data are allowed not allowed to be collected, configured, processed, and communicated in reports (see Ingraham, 2014). Black-boxed processes and configurations enacted on data collected by the GA platform already influence the way collected data is available for reporting, and already reinforce marginalization of marginalized populations. Second, inadvertent filtering of data collected by the GA platform could easily magnify already problematic rhetorical activity limiting access to and reporting on marginalized populations. Filters enable the higher values to float to the top. So the generalization of audiences that is done through these results often excludes users that are vulnerable and need atypical methods of access (see, for example, the way traffic origin is clustered around major metropolitan areas in Figure 6). Technical communicators responsible for community websites can recognize and teach rhetorical awareness of the influence that the GA platform has on reporting the effectiveness of communication and community building efforts.
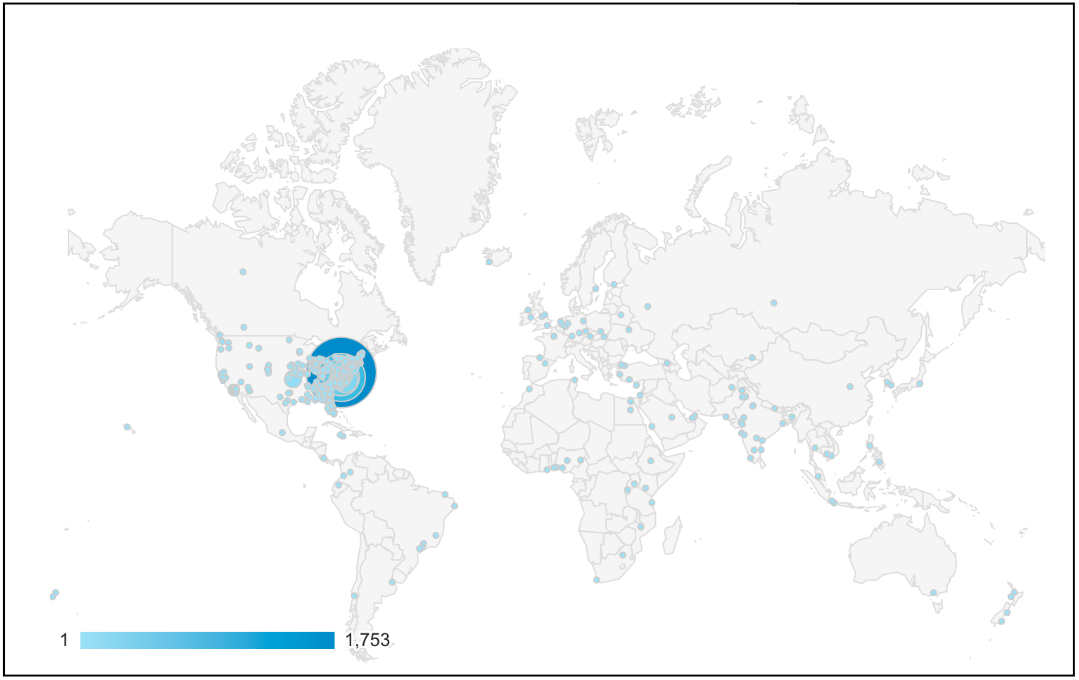 Figure 6. GA Geo > Location report in map form, showing density of web traffic as heatmap. Google and the Google logo are registered trademarks of Google LLC, used with permission.
Neither Nupoor nor Daniel offer proof that marginalization is happening as a result of GA being used for reporting on the effectiveness of online community building tools and sites. We offer this post as the starting point of a conversation about the rhetorical influence of GA, and about web traffic measuring tools generally, in measuring the effectiveness of such sites. We believe GA is a rich site for rhetorical analysis, and that it likely, if not definitively, reinforces the marginalization of already marginalized online populations through aggregation methods that seek and communicate common trends while de-emphasizing, or at least not emphasizing, uncommon behaviors and habits. GA is a big data collection and analysis tool, and its strengths are also its weaknesses. The tool’s ability to surface trends is the same capability that demotes, or retains below easy recognition, the individualized, non-hetero-normative activities of marginalized visitors. Over-reliance on a tool like GA by technical communicators will, in turn, reinforce such marginalizing reports.
Google Analytics is a powerful tool. It enables communicators to identify web and/or app traffic that originates in specific communication artifacts, both internal (the site’s internal referrals) and external (organic, paid, and external referral traffic). Its free reports offer remarkably detailed information about a site’s visitors and their activities on the site. For a community building website, such reports could provide rich, detailed visualizations and case studies of user behaviors (like online interactions among members) from aggregated data. With its parent company Alphabet and its immediate sibling company Google Search, however, the aggregating processing power available to technical communicators can troublingly reinforce the marginalization of the very populations a given community-building tool seeks to engage. As members of this (or any) digital rhetoric collective, such troubling practices beg the question of whether we might create reporting tools that are deployed locally, aggregated locally, and reported locally, without the capital-focused Alphabet juggernaut getting involved. What reporting tools can we suggest that our students implement, or build themselves, to do the important work of reporting the extent that community-building platforms are meeting the needs of the populations they seek to build up? Our tools should first identify the many voices in our communities, then seek to amplify those voices historically marginalized. GA does exactly the opposite: it seeks to amplify the voices of consensus and averages, and to aggregate that consensus. Such actions reinforce marginalization and quiet the voices we so desperately need to amplify.
References
Gonzales, A. L. (2017). Disadvantaged Minorities’ Use of the Internet to Expand Their Social Networks. Communication Research, 44(4), 467–486.
Ingraham, C. (2014). Toward an algorithmic rhetoric. In G. Verhulsdonck & M. Limbu (Eds.), Digital rhetoric and global literacies: Communication modes and digital practices in the networked world (pp. 62-79). Hershey, PA: IGI Global.
Iyamu, T. (2018). A multilevel approach to big data analysis using analytic tools and actor network theory. SA Journal of Information Management, 20(1), 9.
Image Attribution: Today’s Latte: Google Analytics by Flickr user Yuko Honda, CC BY-SA 2.0.
